Behind the scenes at Open Code Quest: how I designed the Leaderboard
At the Red Hat Summit Connect France 2024 , I led a workshop for developers entitled “Open Code Quest”. In this workshop, developers had to code microservices using Quarkus, OpenShift and an Artificial Intelligence service: IBM’s Granite model. The workshop was designed as a speed competition: the first to complete all three exercises received a reward.
I designed and developed the Leaderboard which displays the progress of the participants and ranks them according to their speed. Was it easy? Well, not really, because I imposed a certain style on myself: using Prometheus and Grafana.
Follow me behind the scenes of Open Code Quest: how I designed the Leaderboard!
Workshop description
The Open Code Quest workshop has been designed to accommodate 96 participants who have to complete and validate 3 exercises. Validating the successful completion of an exercise does not involve reading the participant’s code: if the microservice starts and responds to requests, it is validated! So there’s no creative dimension, it’s a race of speed and attention (you just have to read the statement carefully).
The heart of the workshop is a web application simulating a fight between superheroes and super-villains. There are three exercises:
- Developing and deploying the “hero” microservice
- Developing and deploying the “villain” microservice
- Developing and deploying the “fight” microservice
For more details, I direct you to the workshop statement.
Requirements
The Leaderboard should do two things:
- encourage participants by introducing a dose of competition
- determine the fastest 30 participants and award them a prize.
In previous editions of this workshop, successful completion was validated on the basis of screenshots sent to a Slack channel. Participants submitted the screenshots, and the moderator validated them in order, recording the points in a Google Sheet and announcing progress at regular intervals. A moderator was dedicated to managing the leaderboard.
This year, it was expected that the process would be fully automated to avoid these time-consuming administrative tasks.
How it works
As I said in the introduction, for the creation of this Leaderboard I imposed a figure of style on myself: the use of Prometheus and Grafana. Prometheus is a time series database. In other words, it is optimised for storing the evolution of numerical data over time and for producing statistics on this data. Grafana is used to present Prometheus data in the form of dashboards.
These two tools are used extensively in two products that we used for this workshop: Red Hat OpenShift Container Platform and Red Hat Advanced Cluster Management. Prometheus is very good at knowing that “Pod X in namespace Y has just entered the Running state”. And that’s precisely what we’re interested in:
- If the hero-database-1 Pod is created in the batman-workshop-prod namespace, then we know that the batman user has just finished deploying the hero exercise database in the prod environment.
- If the Deployment hero in the batman-workshop-prod namespace changes to the Available state, then we know that the batman user has successfully deployed his hero microservice.
- If a batman-hero-run-<random>-resync-pod Pod in the batman-workshop-dev namespace changes to the Completed state, then we know that the user’s last Tekton pipeline has been successfully completed.
And if the three previous conditions are true, we can deduce that the user has completed and validated the hero exercise. Over time, these time series progress as shown in the figure below.
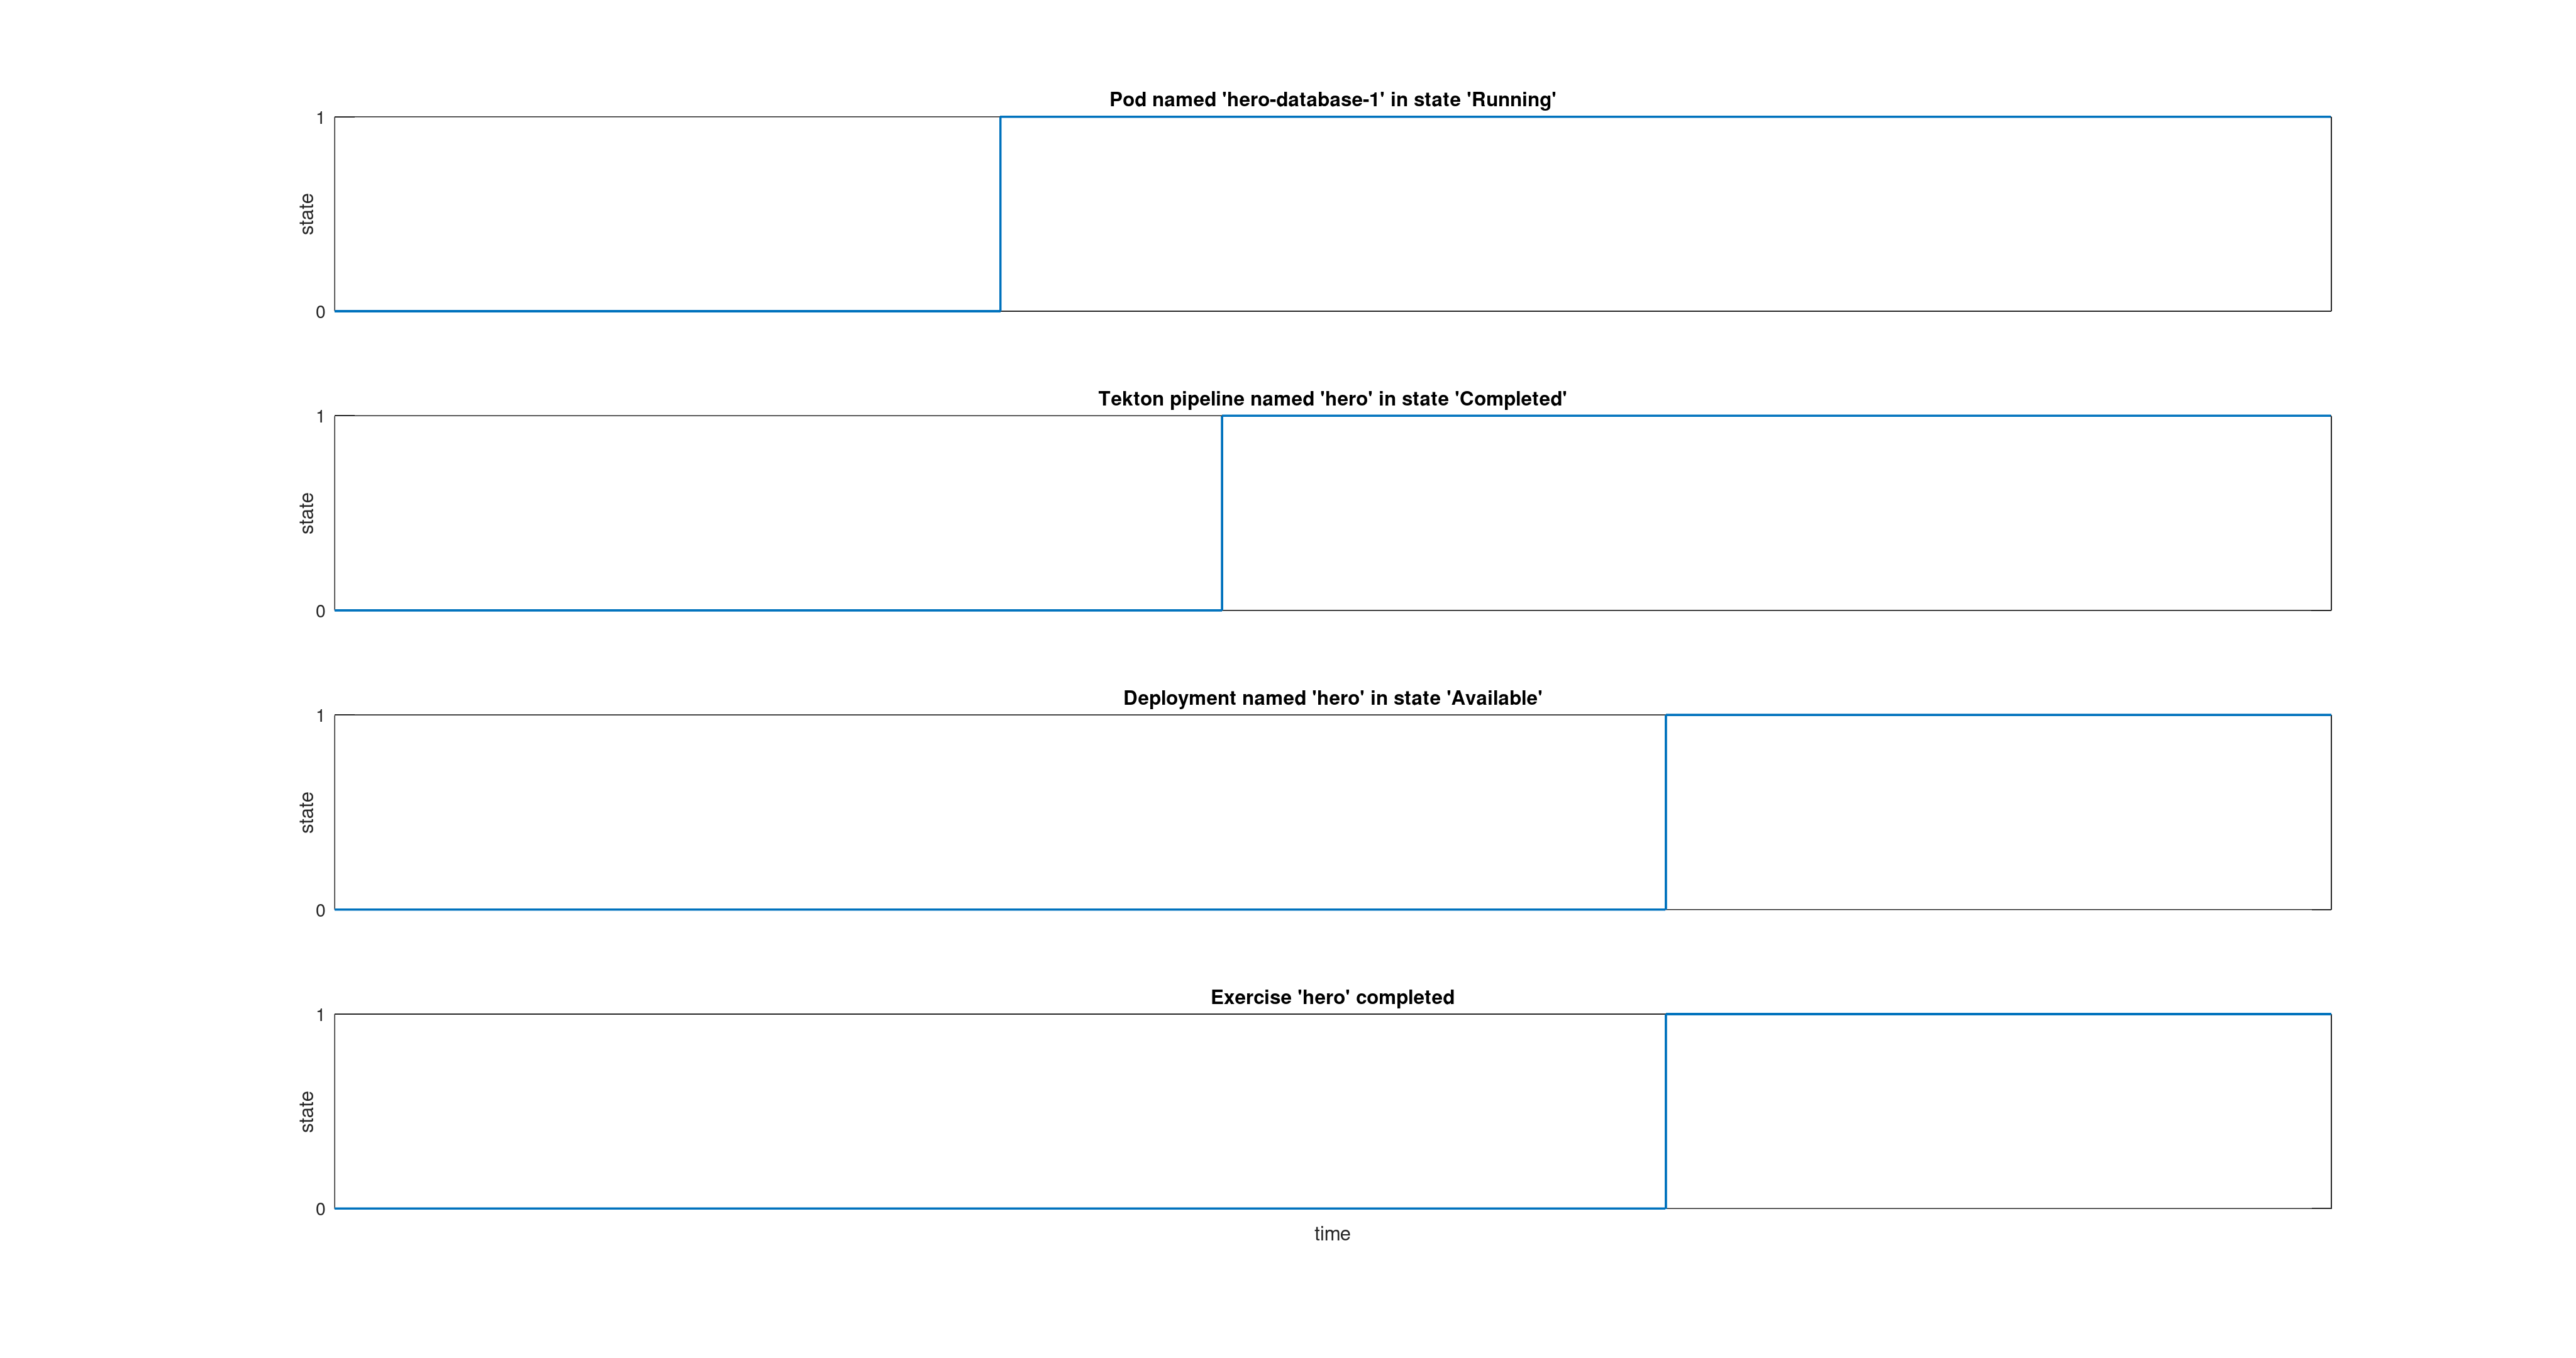
That’s a good start, isn’t it? If you do the same thing for all three exercises, you can see who has completed the whole workshop.
Given that some exercises take longer than others, we could imagine awarding more points to long exercises and fewer to short ones. This is the approach I’ve tried to model in the figure below, with a weighting of 55 for the first exercise, 30 for the second and 45 for the last. The idea is to approximate a linear progression of points over time (1 point per minute).
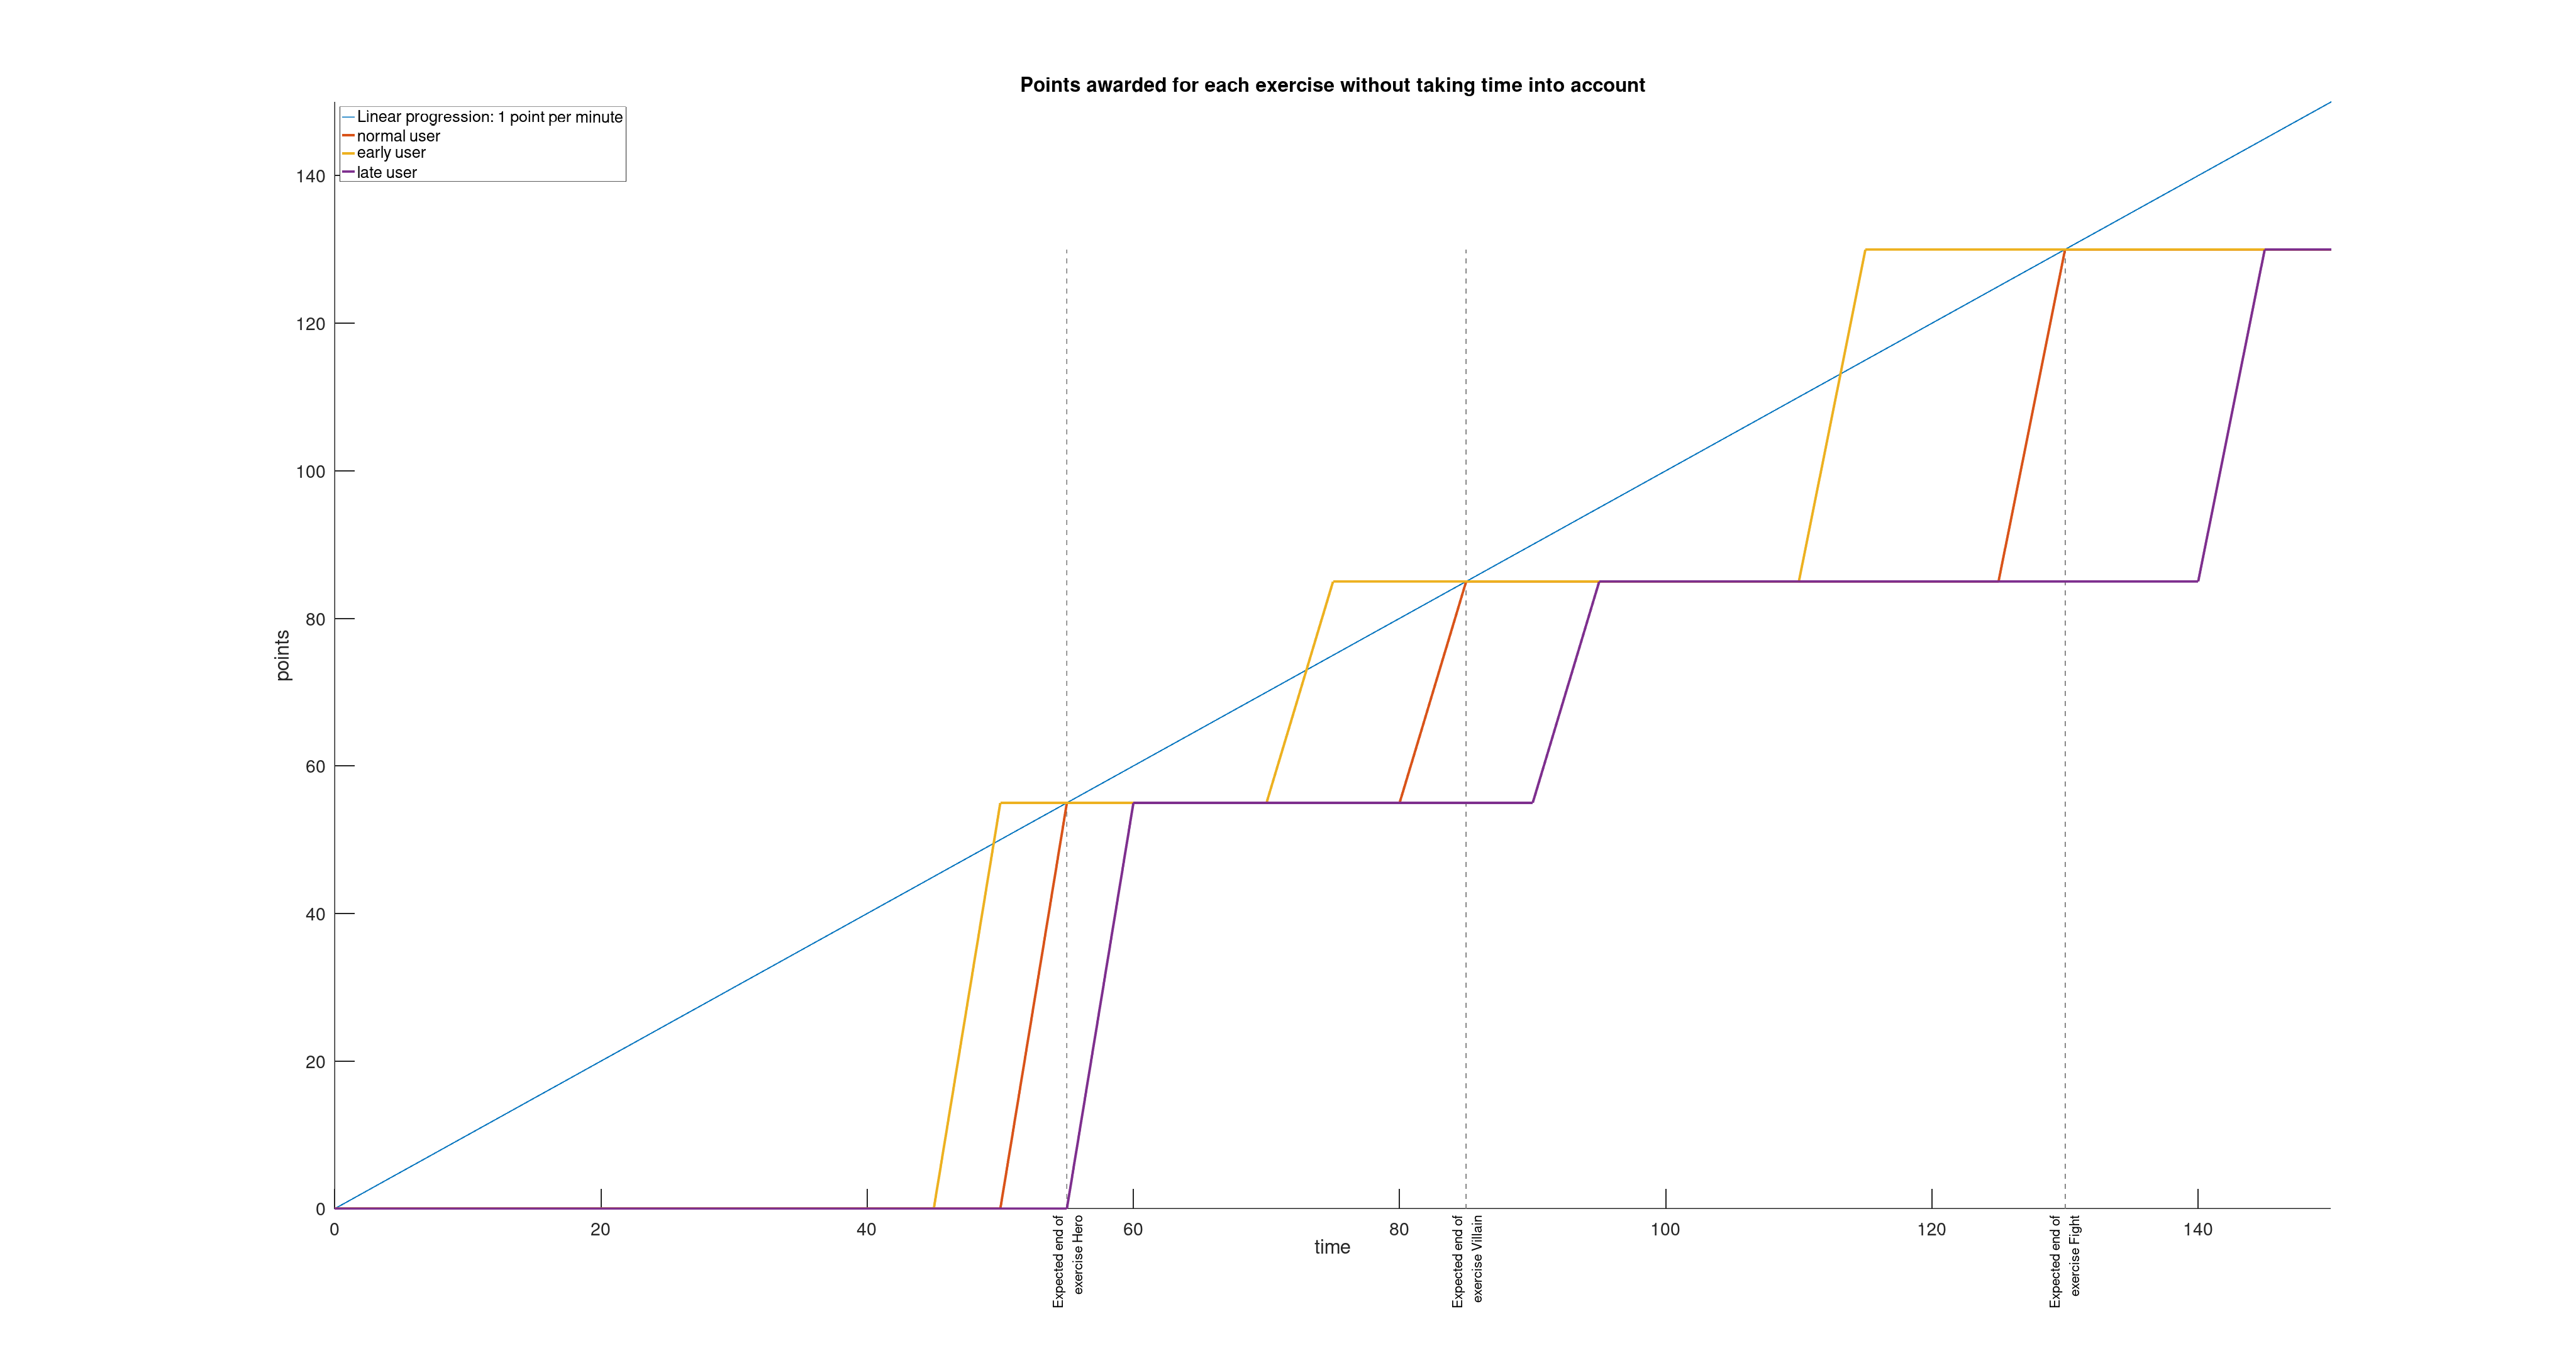
It’s starting to come together. But if you look closely, at the end of the workshop (at the 150th minute), all the participants have finished and have the same score.
And that poses two problems for me:
- Firstly, Prometheus doesn’t know how to sort participants by order of arrival. And I don’t want to have to analyse the results minute by minute at the prize-giving ceremony to manually note the order of arrival of the participants.
- Then, if all the participants who have completed an exercise have the same score, where’s the thrill of the competition?
I know that with any SQL database you’d just have to do a SELECT * FROM users ORDER BY ex3_completion_timestamp ASC to get the result.
I know I’m trying to use Prometheus for a task that isn’t really its job.
But, let’s be silly…
Let’s dream for a minute…
How about we try and get around this limitation of Prometheus?
Couldn’t we moderate or accentuate the weighting of an exercise according to the time taken by the user to complete it?
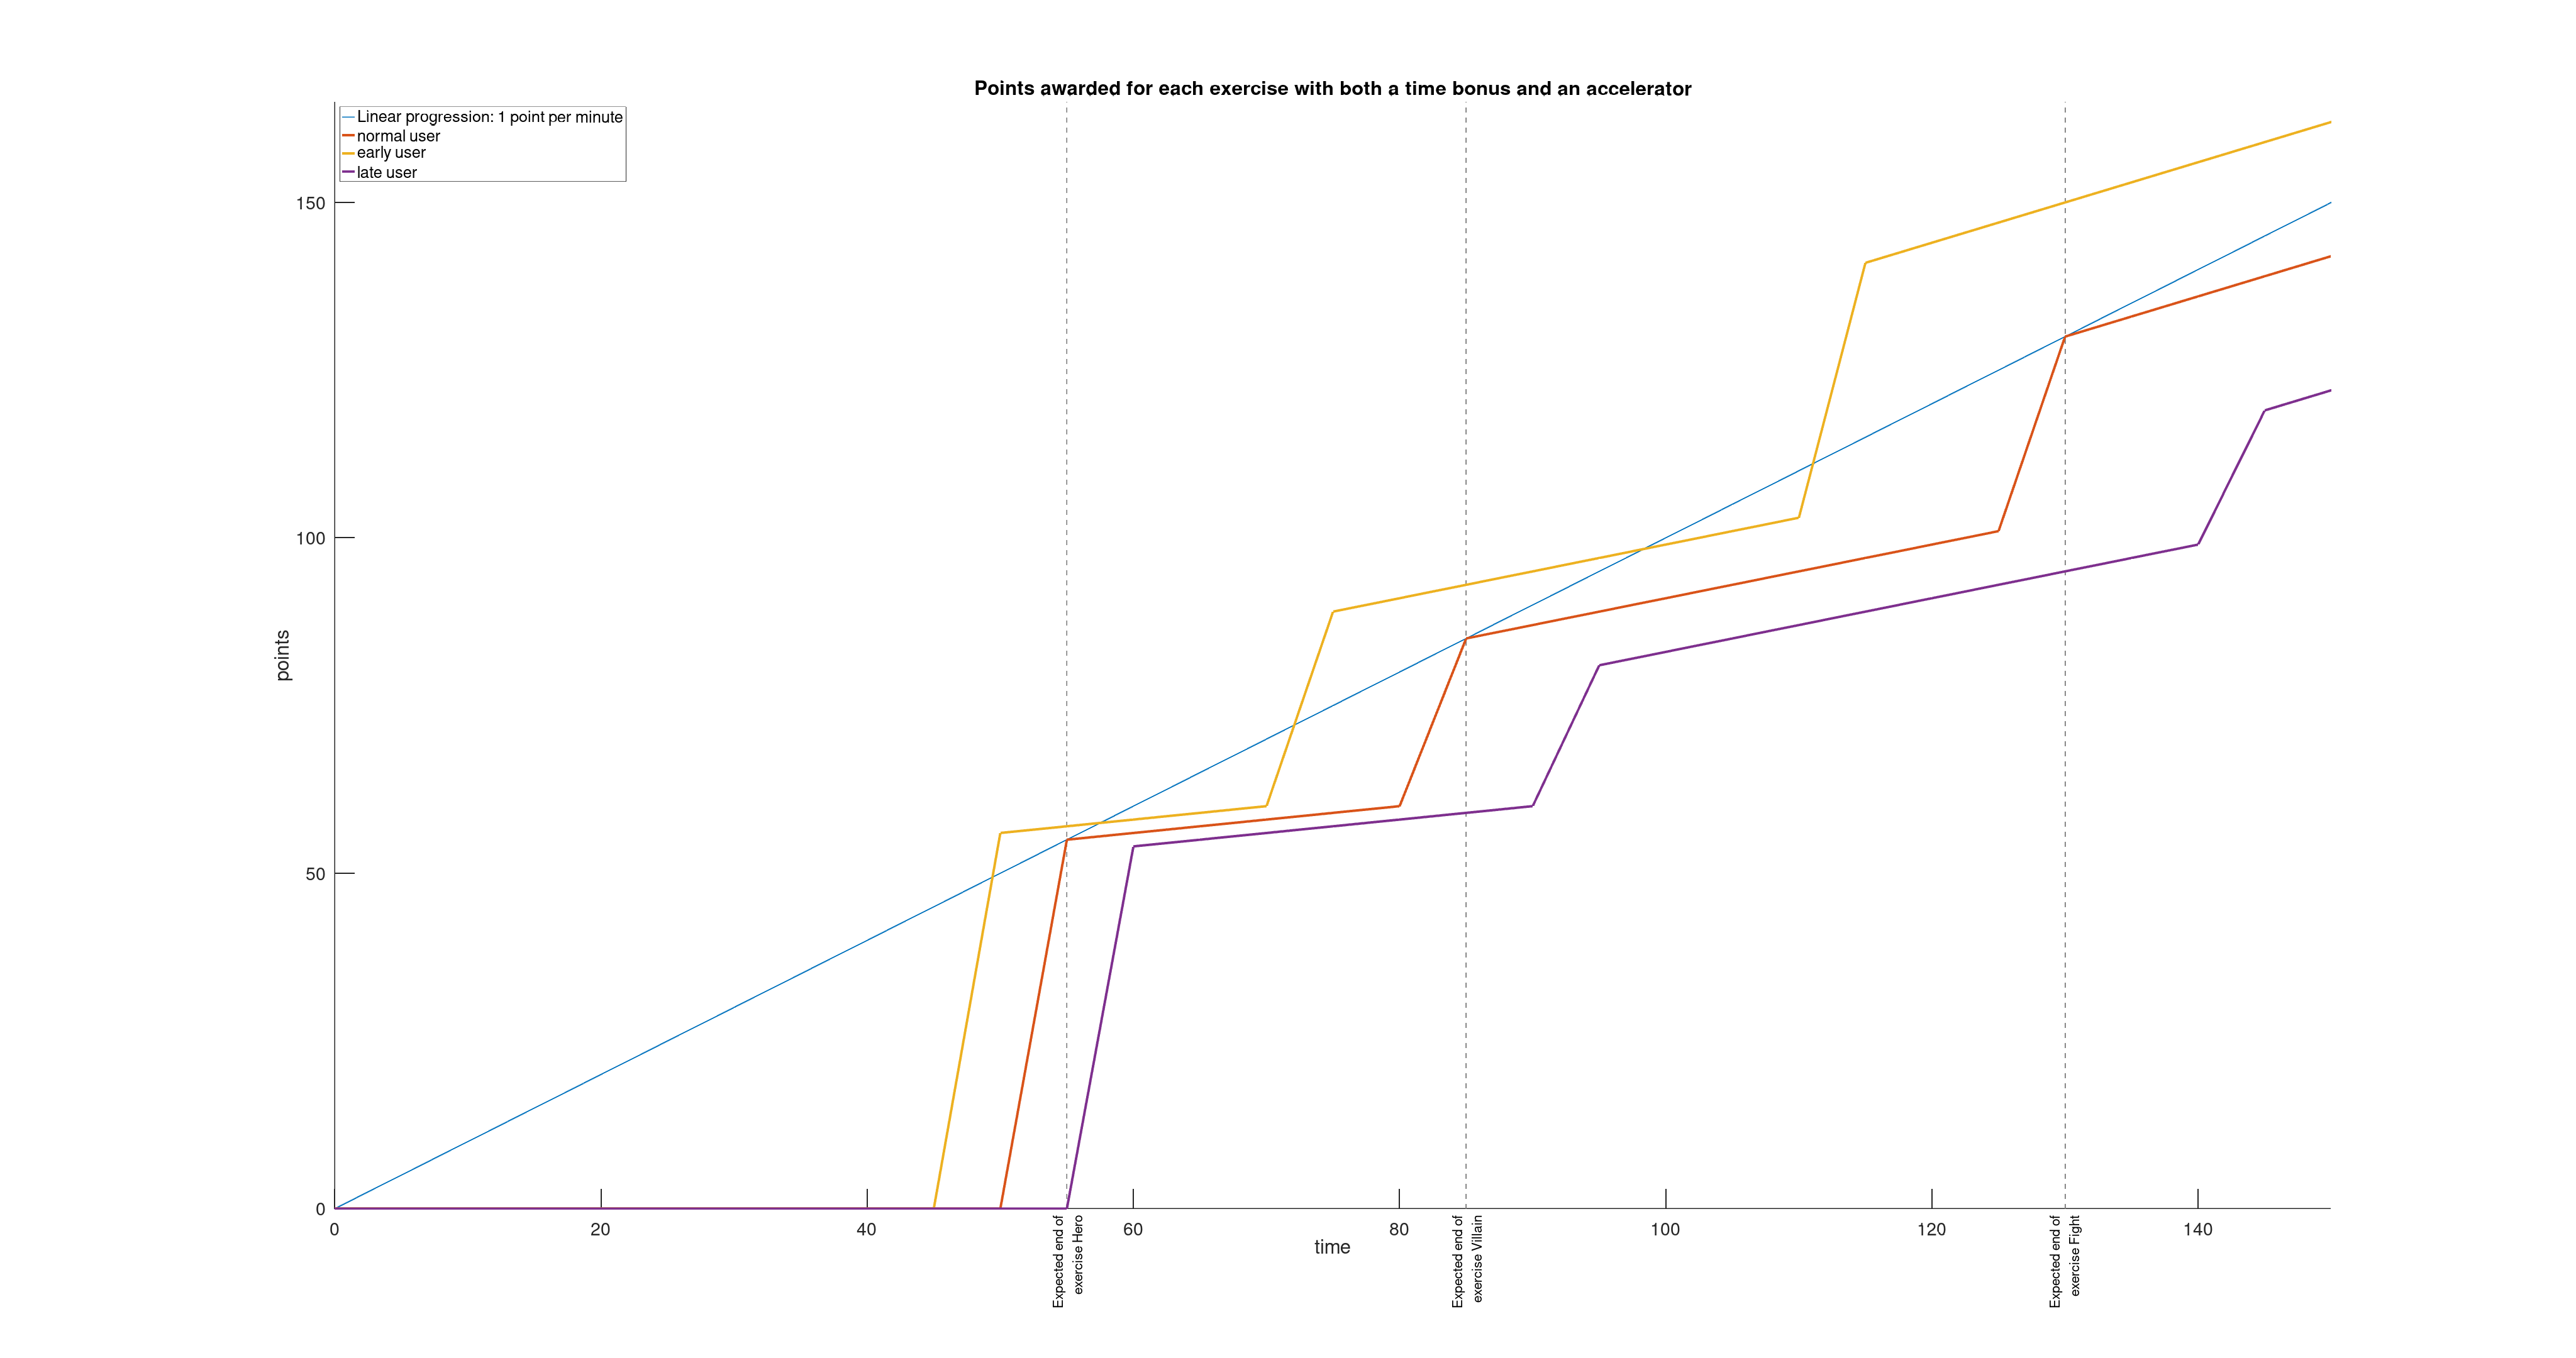
Couldn’t an accelerator be activated each time an exercise is validated, giving a few extra points for every minute that passes?
That would make the competition more engaging and more fun!
And that’s what I’ve tried to model in the diagram below.
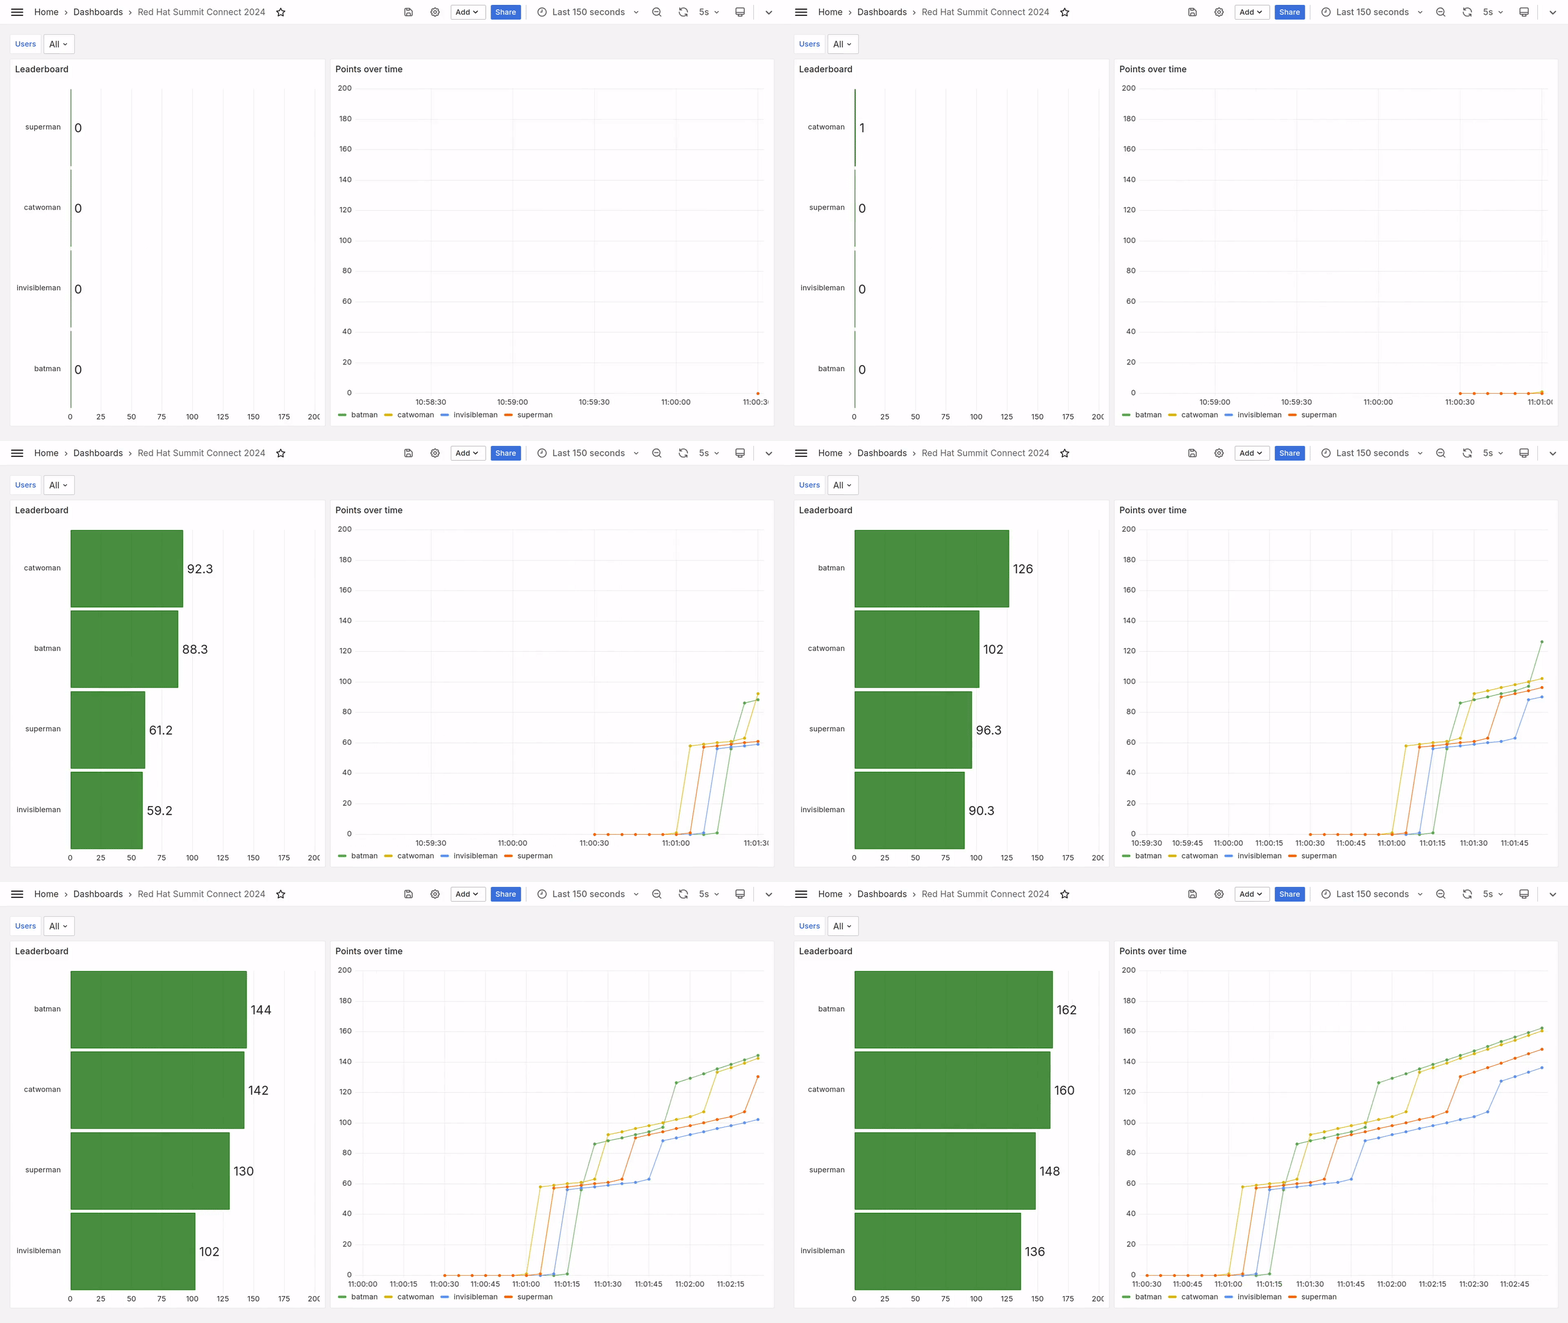
Now the question is: does a user who takes the lead in the first exercise gain a significant advantage that would make the competition unbalanced? We found the answer during the various rehearsals that took place at Red Hat before D-Day.

In the screenshot above, you can see that Batman completed the “hero” exercise late.
But by completing the “villain” exercise very quickly, he was able to take back the lead… temporarily.
Catwoman, who was leading the game, passed him again before Batman regained the lead and held on to it until the last moment.
Phew! What a thriller!
So, it’s definitely possible to start late and catch up.
The principle is validated! And now, how do we implement this in Prometheus?
Implementation in Prometheus
If I had had to develop this point-counting system in a Prometheus pre-configured for production, I would have faced two difficulties:
- By default, the time resolution of the Prometheus + Grafana suite included in Red Hat Advanced Cluster Management is 5 minutes (this corresponds to the minimum time step between two measurements). Validating the correct counting of points with a resolution of 5 minutes over a 2.5 hour shift takes 2.5 hours (real speed).
- To implement this point-counting system, I need to use recording rules. However, modifying a recording rule does not automatically trigger the rewriting of time series calculated in the past.
For these two reasons, I decided to use a specific testing workbench.
Using a testing workbench
The specific features of this testing workbench are as follows:
- Prometheus scrapping frequency is set to 5 seconds. This means that validating the scoring accuracy is done 60 times faster: 2.5 hours of workshop time is validated in 2 minutes and 30 seconds, with a resolution of 5 minutes.
- At each iteration, Prometheus is reconfigured with the new recording rules, past time series are erased and Prometheus immediately starts recording new time series from a standardised test data set.
This makes fine-tuning much easier!
The testing workbench is available in the Git repository opencodequest-leaderboard and requires only a few pre-requisites: git, bash, podman, podman-compose and the envsubst command. These dependencies can usually be installed with your distribution’s packages (dnf install git bash podman podman-compose gettext-envsubst on Fedora).
Get the code for the testing workbench and start it:
git clone https://github.com/nmasse-itix/opencodequest-leaderboard.git
cd opencodequest-leaderboard
./run.sh
The first time you start up, connect to the Grafana interface (http://localhost:3000) and carry out these 4 actions:
- Authenticate with login admin and password admin.
- Set a new administrator password (or just click on Skip…)
- Configure a default data source of type Prometheus with the following values:
- Prometheus server URL:
http://prometheus:9090 - Scrape interval:
5s.
- Prometheus server URL:
- Create a new dashboard from the grafana/leaderboard.json file in the Git repository.
Data should now appear in the Grafana dashboard.
To enjoy this to the full, stop the run.sh script by pressing Ctrl + C and run it again!
After a few seconds, you should see fresh data appear on the dashboard, as in the video below.
Prometheus queries
The Prometheus queries I used are stored in the file prometheus/recording_rules.yaml.template.
This is a template that contains variables.
The variables are replaced by their values when the run.sh script is run.
All requests are recorded in the form of Prometheus recording rules. They are divided into three groups:
- The
opencodequest_leaderboard_*queries represent the state of completion of an exercise by a user. - The
opencodequest_leaderboard_*_onetime_bonusrequests represent the time bonus acquired by a user who completes an exercise. - The
opencodequest_leaderboard_*_lifetime_bonusqueries represent the carry-over of the time bonus acquired by a user who completes an exercise.
Queries opencodequest_leaderboard_*
The three queries you need to understand first are :
opencodequest_leaderboard_hero:prod: hero exercise completion status (0 = not completed, 1 = completed)opencodequest_leaderboard_villain:prod: villain exercise completion status (ditto)opencodequest_leaderboard_fight:prod: fight exercise completion status (ditto)
These three queries are based on the same model.
I’ve taken the first one and adapted and formatted it slightly to make it more understandable.
It’s almost a valid request.
Before executing it, you’ll just have to replace $EPOCHSECONDS with the unix timestamp of the current time.
sum(
  timestamp(
    label_replace(up{instance="localhost:9090"}, "user", "superman", "","")
  ) >= bool ($EPOCHSECONDS + 55)
  or
  timestamp(
    label_replace(up{instance="localhost:9090"}, "user", "catwoman", "","")
  ) >= bool ($EPOCHSECONDS + 50)
  or
  timestamp(
    label_replace(up{instance="localhost:9090"}, "user", "invisibleman", "","")
  ) >= bool ($EPOCHSECONDS + 60)
  or
  timestamp(
    label_replace(up{instance="localhost:9090"}, "user", "batman", "","")
  ) >= bool ($EPOCHSECONDS + 65)
) by (user)
To replace $EPOCHSECONDS with the unix timestamp of the current time, you can use a here-doc in your favourite Shell:
cat << EOF
Prometheus query
EOF
Copy and paste the query into the Explore section of Grafana and you should get the following graph.
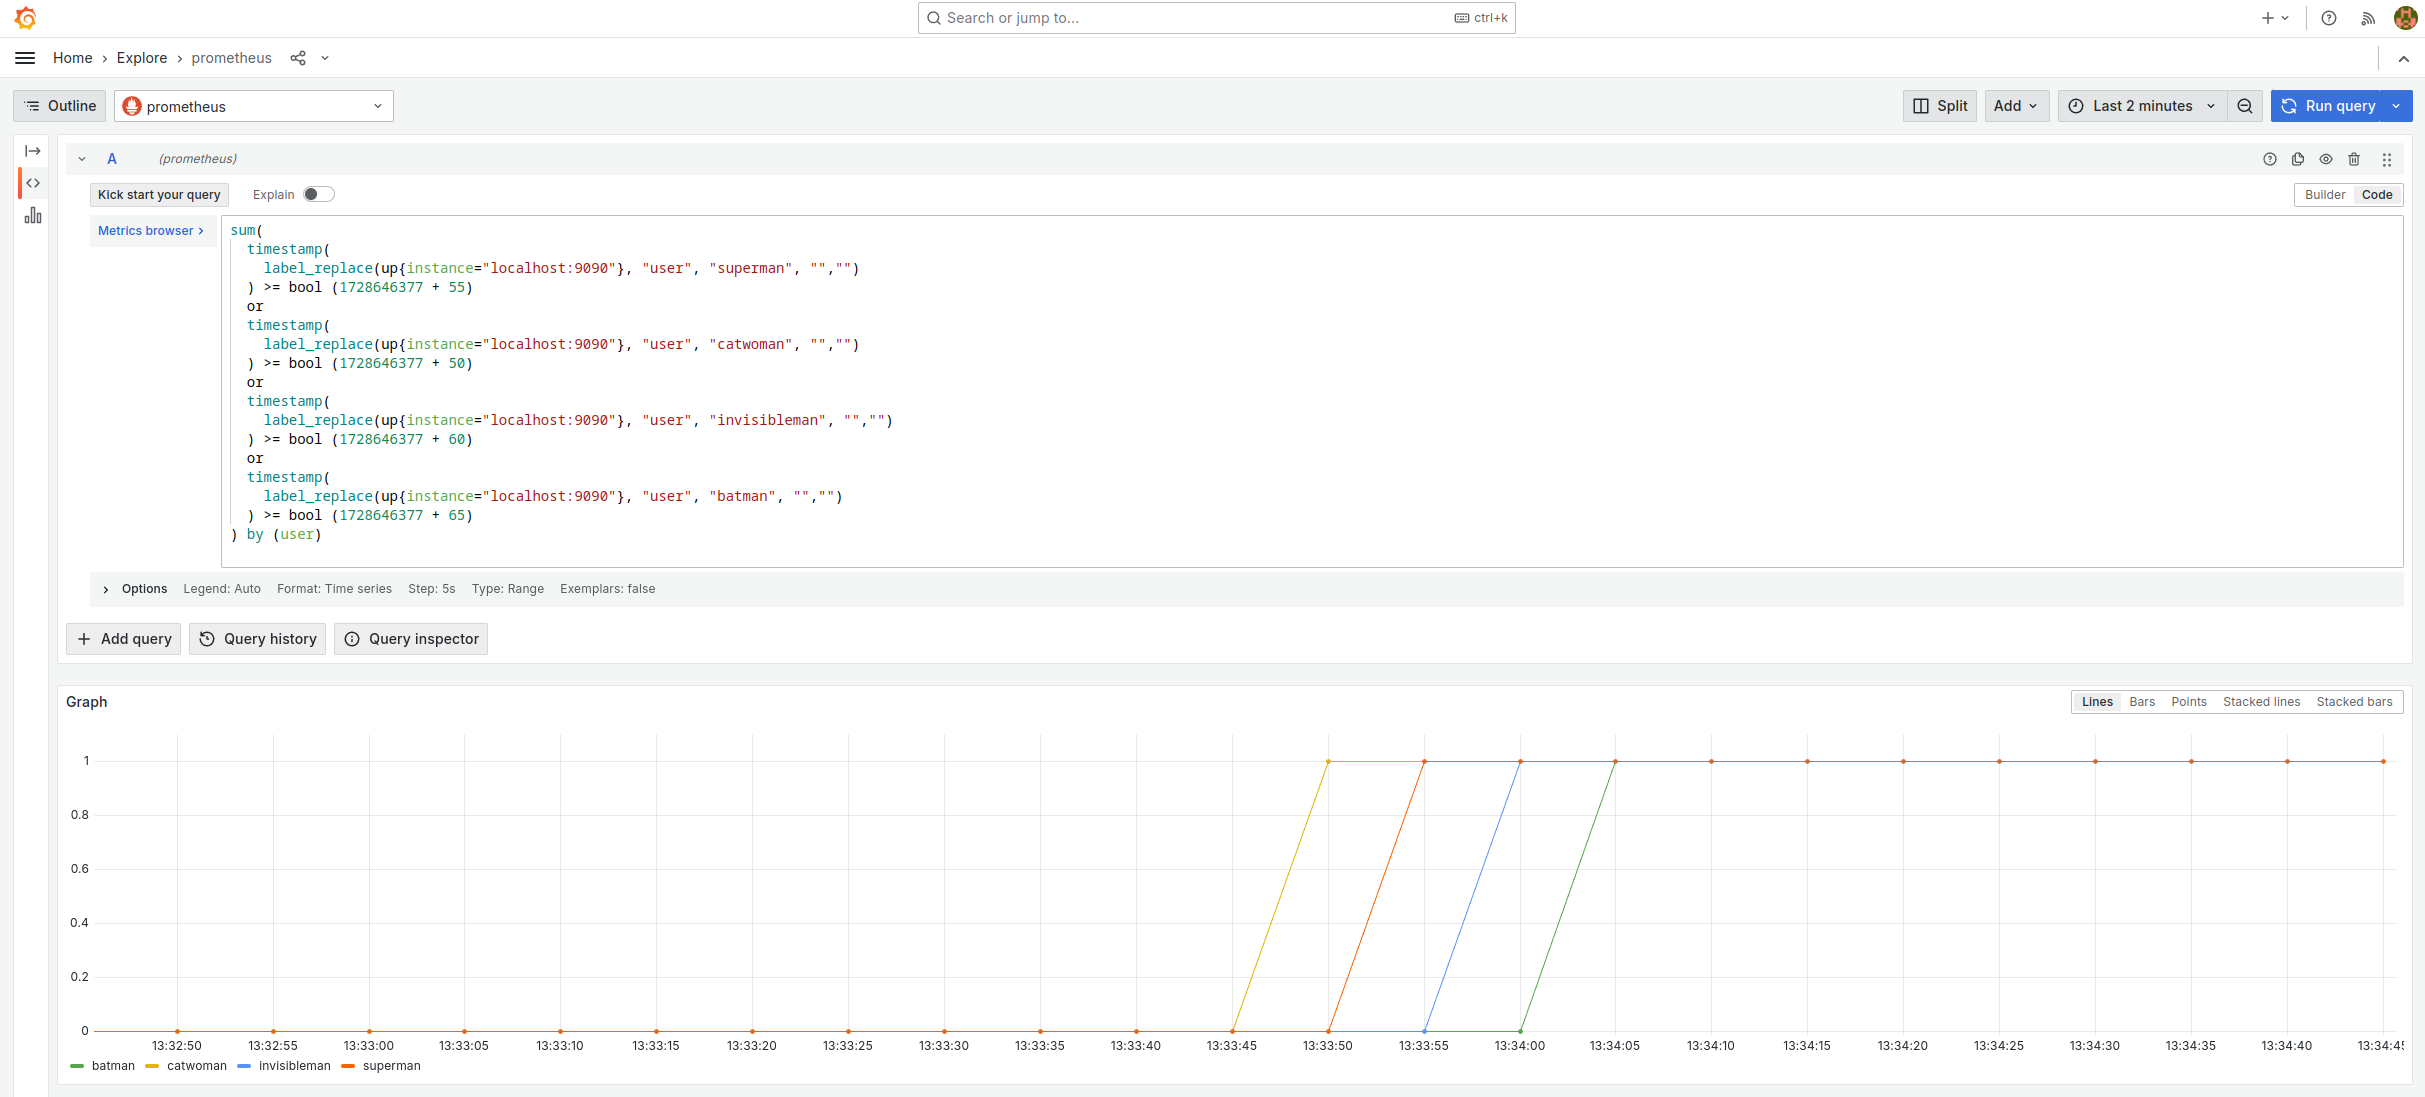
It should be read as follows (note: 1728646377 = 13:32:57):
- Superman finishes the hero exercise 50 seconds after the workshop has started.
- Catwoman finishes the hero exercise 55 seconds after the workshop has started.
- Invisible Man finishes the hero exercise 60 seconds after the workshop has started.
- Batman ends the hero exercise 65 seconds after the workshop has started.
This query works as follows:
up{instance="localhost:9090"}is a time serie which always returns 1, accompanied by lots of labels which are useless for our purposes.label_replace(TIMESERIE, "user", "superman", "", "")adds the label user=superman to the time serie.timestamp(TIMESERIE) >= bool TSreturns 1 for any measurement taken after the timestamp TS, 0 otherwise.TIMESERIE1 or TIMESERIE2merges the two time series.sum(TIMESERIE) by (user)removes all labels exceptuser. I could have usedmin,max, etc. instead ofsumas I only have one timeserie per user value.
The results of these three queries are stored in Prometheus in the form of time series, thanks to the recording rules which define them.
These represent the test data set which I use to validate that the Leaderboard is working properly. In the Open Code Quest environment, they will be replaced by real metrics from the OpenShift clusters.
Queries opencodequest_leaderboard_*_onetime_bonus
The following queries calculate a time bonus for users who complete an exercise. The earlier the user completes the exercise (in relation to the scheduled end time), the greater the bonus. Conversely, the later the user is in relation to the scheduled end time, the smaller the bonus.
opencodequest_leaderboard_hero_onetime_bonus:prodrepresents the time bonus awarded to the user who completes the hero exercise.opencodequest_leaderboard_villain_onetime_bonus:prodrepresents the time bonus awarded to the user who completes the villain exercise.opencodequest_leaderboard_fight_onetime_bonus:prodrepresents the time bonus awarded to the user who completes the fight exercise.
These three queries are based on the same model. It may seem complex at first, but in fact it’s not that complex.
(increase(opencodequest_leaderboard_hero:prod[10s]) >= bool 0.5)
*
(
  55
  +
  sum(
      (
        ${TS_EXERCISE_HERO}
        -
        timestamp(
          label_replace(up{instance="localhost:9090"}, "user", "superman", "","")
          or
          label_replace(up{instance="localhost:9090"}, "user", "invisibleman", "","")
          or
          label_replace(up{instance="localhost:9090"}, "user", "catwoman", "","")
          or
          label_replace(up{instance="localhost:9090"}, "user", "batman", "","")
        )
      ) / 5
  ) by (user)
)
To understand how this query works, I suggest you split it into two parts: the increase(...) part on one side and the rest on the other.
We overlay this with the previous query and we get the following figure.
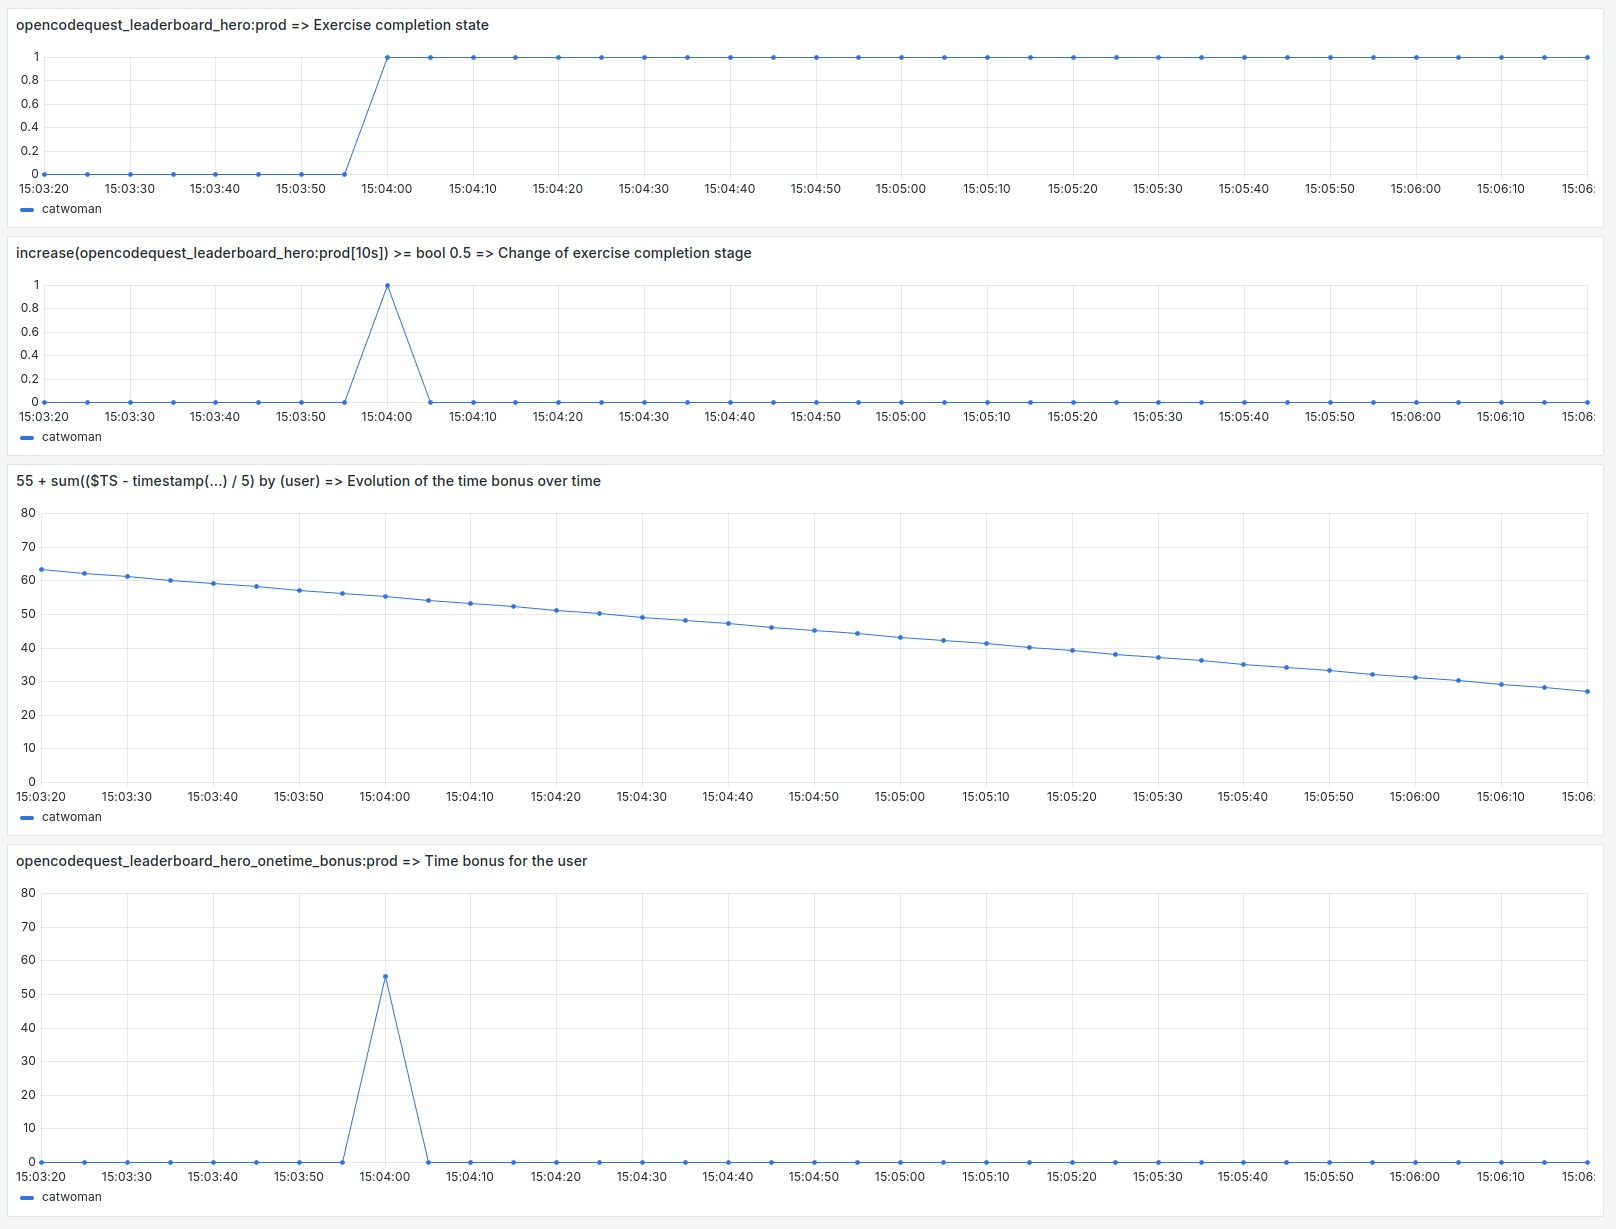
From top to bottom, we can see:
- The
opencodequest_leaderboard_hero:prodquery. It represents the completeness of the exercise. - The
increase(opencodequest_leaderboard_hero:prod[10s]) >= bool 0.5part detects changes in the state of the previous query. - The part
55 + sum(($TS - timestamp(...) / 5) by (user)represents the evolution of the time bonus over time. The term 55 is the nominal bonus for the exercise and the divisor 5 is used to vary the bonus by one unit every 5 seconds. - The total is the application of the time bonus at the moment the user completes the exercise.
Queries opencodequest_leaderboard_*_lifetime_bonus
The following queries carry forward the time bonus from measurement to measurement until the end of the workshop.
opencodequest_leaderboard_hero_lifetime_bonus:prodrepresents the carryover of the time bonus awarded to the user who completes the hero exercise.opencodequest_leaderboard_villain_lifetime_bonus:prodrepresents the carryover of the time bonus awarded to the user who completes the villain exercise.opencodequest_leaderboard_fight_lifetime_bonus:prodrepresents the carryover of the time bonus awarded to the user who completes the fight exercise.
These three queries are based on the same model:
sum_over_time(opencodequest_leaderboard_hero_onetime_bonus:prod[1h])
The function sum_over_time(TIMESERIES) sums the values of the time serie over time.
This can be seen as the integral of the time serie.
The following figure shows how this query works in more detail.
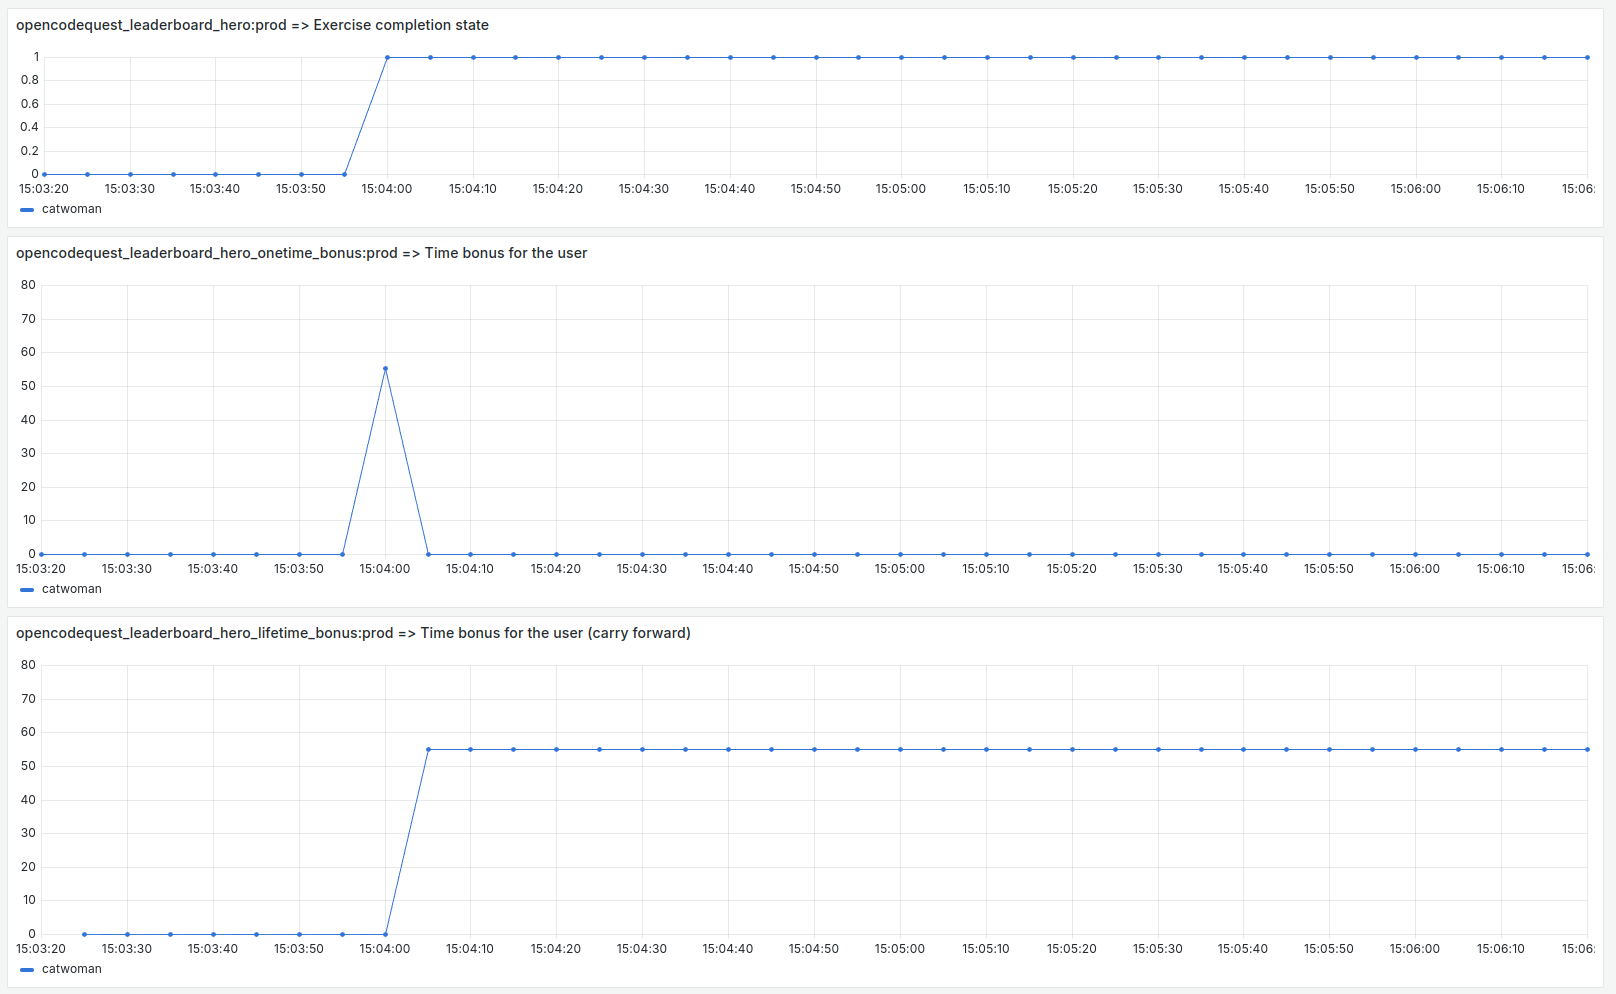
From top to bottom, we can observe:
- The
opencodequest_leaderboard_hero:prodquery. It represents the completeness of the exercise. - The query
opencodequest_leaderboard_hero_onetime_bonus:prod. This represents the application of the time bonus when the user completes the exercise. - The result is the time bonus carried forward from the moment the user completes the exercise.
Note: there is a time difference of one unit between the last query and the first two. I think this is a consequence of the dependencies between the recording rules.
The final query
The final query that determines user score is the sum of 6 components:
- The time bonus for the hero exercise (carried over)
- The accelerator activated at the end of the hero exercise
- The time bonus for the villain exercise (carried over)
- Accelerator activated at the end of the villain financial year
- Time bonus for fight exercise (postponed)
- Accelerator activated at the end of the fight exercise
In the dialect used by Prometheus, this is written as follows:
opencodequest_leaderboard_hero_lifetime_bonus:prod
+ sum_over_time(opencodequest_leaderboard_hero:prod[1h])
+ opencodequest_leaderboard_villain_lifetime_bonus:prod
+ sum_over_time(opencodequest_leaderboard_villain:prod[1h])
+ opencodequest_leaderboard_fight_lifetime_bonus:prod
+ sum_over_time(opencodequest_leaderboard_fight:prod[1h])
The time bonuses were described in the previous section.
All that remains to explain is how the accelerator works.
The time series opencodequest_leaderboard_{hero,villain,fight}:prod is the completeness state of the exercise (binary value: 0 or 1).
To obtain a ramp, you need to take its integral.
So I use the function sum_over_time(TIMESERIES) for this.
To make things more complicated, you could imagine changing the slope of the ramp using a multiplier, but I’ve decided that this isn’t necessary.
In fact, the 3 accelerators already add up, so the user gains 1 point every 5 minutes after the hero exercise, 2 points after the villain exercise and 3 points after the fight exercise.
The following figure shows the 6 Prometheus query components used to calculate the user’s score.
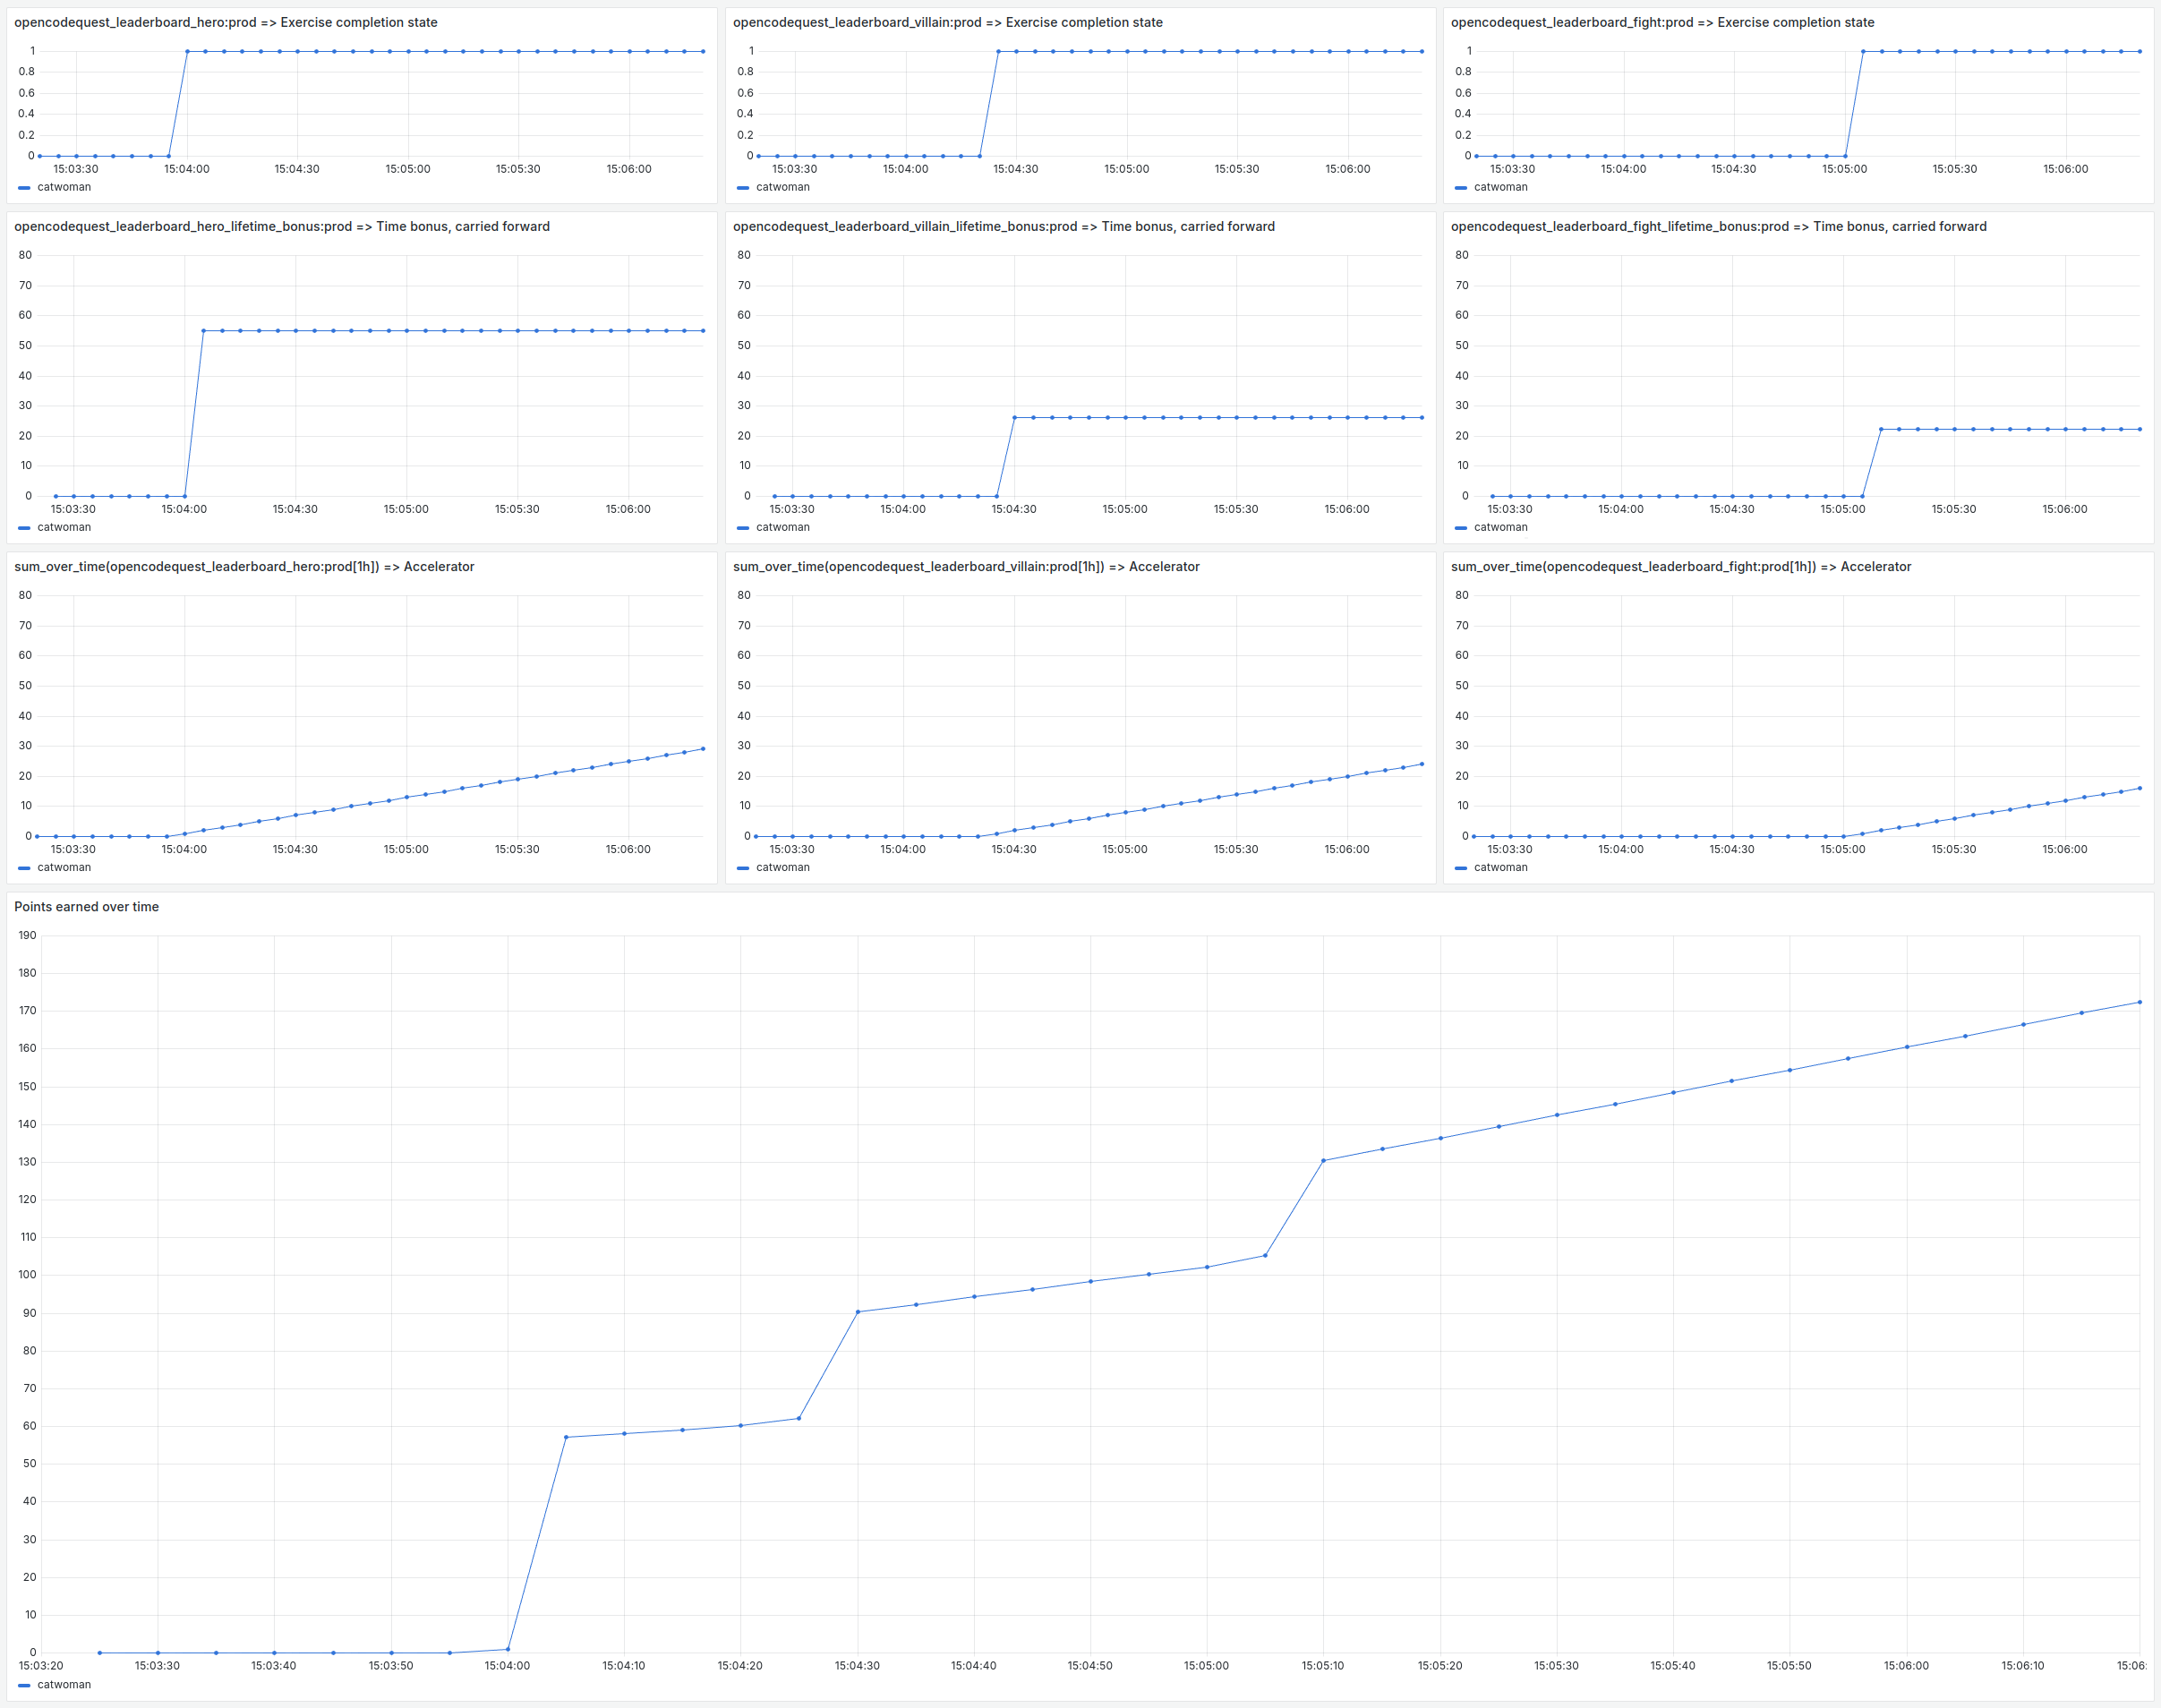
Recording Rules
The opencodequest_leaderboard_* queries use the increase function and the opencodequest_leaderboard_*_lifetime_bonus queries use the sum_over_time function.
These two Prometheus functions have one constraint: they can only be applied on a range vector (this is the timeserie[range] syntax you saw in the examples above).
And a range vector cannot be the result of a calculation.
This means that the following query is valid:
// OK
sum_over_time(
  opencodequest_leaderboard_hero:prod[1h]
)
But these are not:
// parse error: ranges only allowed for vector selectors
sum_over_time(
  (1 + opencodequest_leaderboard_hero:prod)[1h]
)

// parse error: binary expression must contain only scalar and instant vector types
sum_over_time(
  1 + opencodequest_leaderboard_hero:prod[1h]
)
This means that it is not possible to build a giant query which calculates the score of all the participants over time. So each time we use one of these functions that requires a range vector, we have to use a recording rule to materialise the result of the calculation in a named time serie. And because our queries depend on each other, they have to be placed in different recording rule groups.
This is why you will find three groups of recording rules in the prometheus/recording_rules.yaml.template file:
opencodequest_basefor the test dataset (which only exists in the testing workbench).opencodequest_step1for theopencodequest_leaderboard_*_onetime_bonusqueries.opencodequest_step2for theopencodequest_leaderboard_*_lifetime_bonusqueries.
And you’ll see in the following article that recording rules in a Red Hat Advanced Cluster Management configuration have a few subtleties…
Creating the Grafana dashboard
Once all the Prometheus queries have been set up, creating the Grafana dashboard is relatively straightforward:
- Create two variables: env (the participant environment on which to calculate the score) and user (the list of users to be included in the leaderboard).
- Add two visualisations: one for the instant ranking and one for the progression of scores over time.
The user variable is multi-valued (you can select all users or uncheck users you don’t want to see… like those who were used to test the day before!) and the possible values are taken from the labels of a Prometheus time series (it doesn’t matter which one, as long as all users are represented).
The env variable has three possible values (“dev”, “preprod” or “prod”) but you can only select one value at a time.
These two variables are then used in the Leaderboard query in the following way:
max(
  opencodequest_leaderboard_hero_lifetime_bonus:${env:text}{user=~"${user:regex}"}
  + sum_over_time(opencodequest_leaderboard_hero:${env:text}{user=~"${user:regex}"}[1h])
  + opencodequest_leaderboard_villain_lifetime_bonus:${env:text}{user=~"${user:regex}"}
  + sum_over_time(opencodequest_leaderboard_villain:${env:text}{user=~"${user:regex}"}[1h])
  + opencodequest_leaderboard_fight_lifetime_bonus:${env:text}{user=~"${user:regex}"}
  + sum_over_time(opencodequest_leaderboard_fight:${env:text}{user=~"${user:regex}"}[1h])
) by (user)
The ${user:regex} syntax allows Grafana to replace user=~"${user:regex}" with user=~"(batman|catwoman|invisibleman|superman)" when several values are selected in the drop-down list.
Visualising instant ranking
To show the instant ranking, I used the Bar Chart visualisation with a Sort by transformation on the Value field.
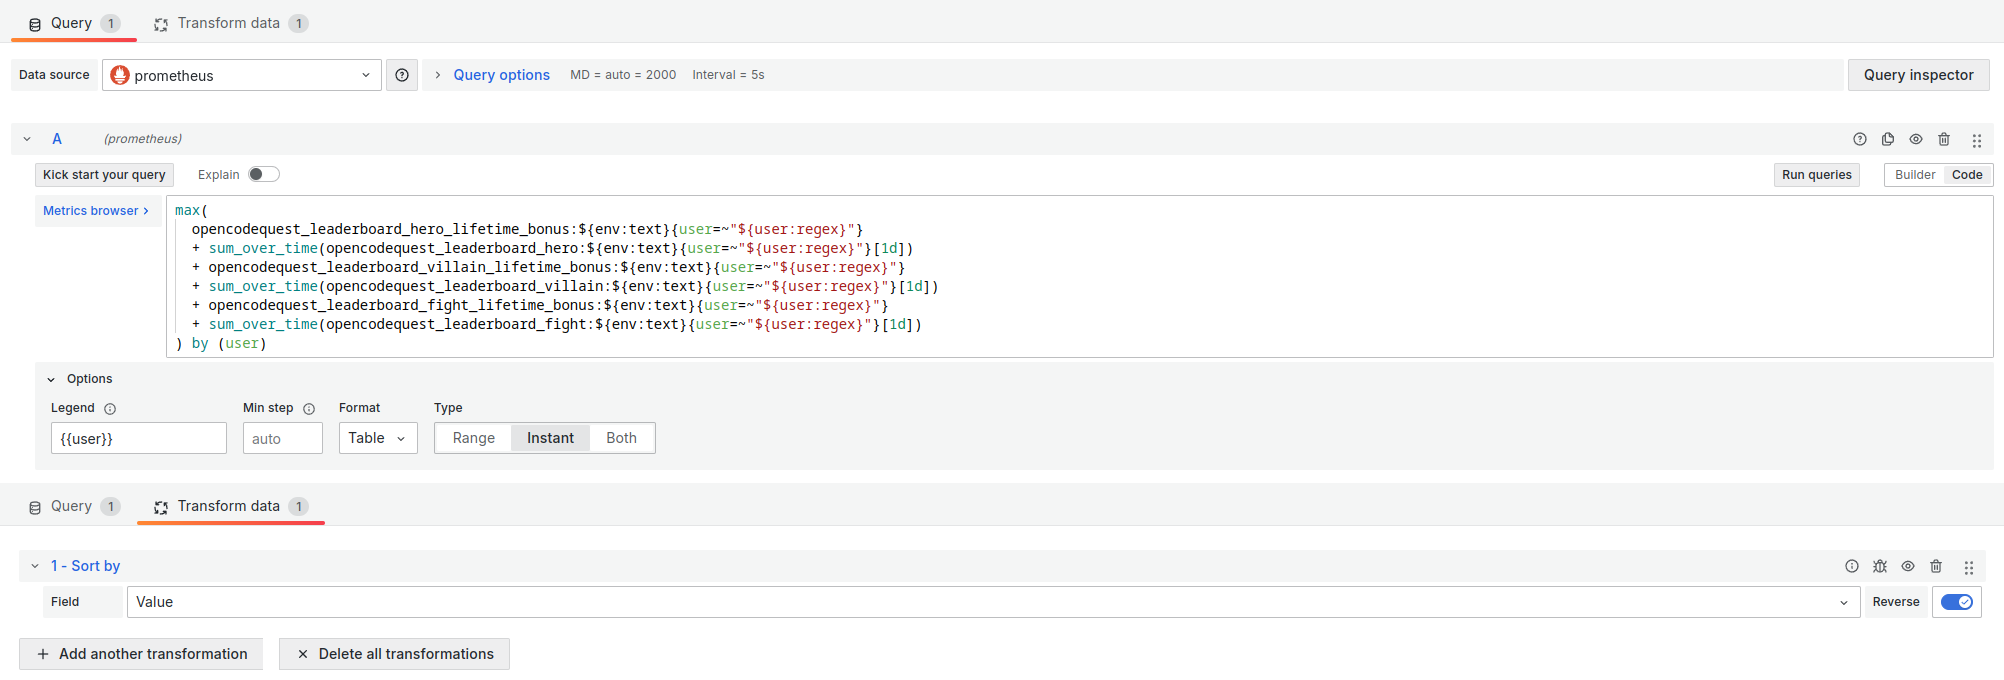
The important parameters of this visualisation are :
- Format:
Table - Type: `Instant
- Legend:
{{user}}(to display the participant’s name next to their score)
Viewing scores over time
To track the progression of scores over time, I have opted for the Time series visualisation.

The important parameters of this visualisation are :
- Format:
Time series - Type:
Range - Min step:
5sin the testing workbench and5min real life.
Result
The dashboard used on the day of Open Code Quest was more or less as shown in Figure 5 (the animated gif):
- The instant ranking, projected from time to time on the overhead projector to announce the scores.
- The progression of scores over time, displayed on a second screen to keep an eye on the competition.
You can find all the Grafana dashboards presented here in the grafana folder.
The day of the Open Code Quest
On the day of the Open Code Quest, the Leaderboard worked well and enabled us to determine the fastest 30 participants. They went up on stage to receive a reward.
As for the question on everyone’s lips: did superheroes fight it out for the podium? The answer is a resounding YES! And there were plenty of thrills when the results were announced…
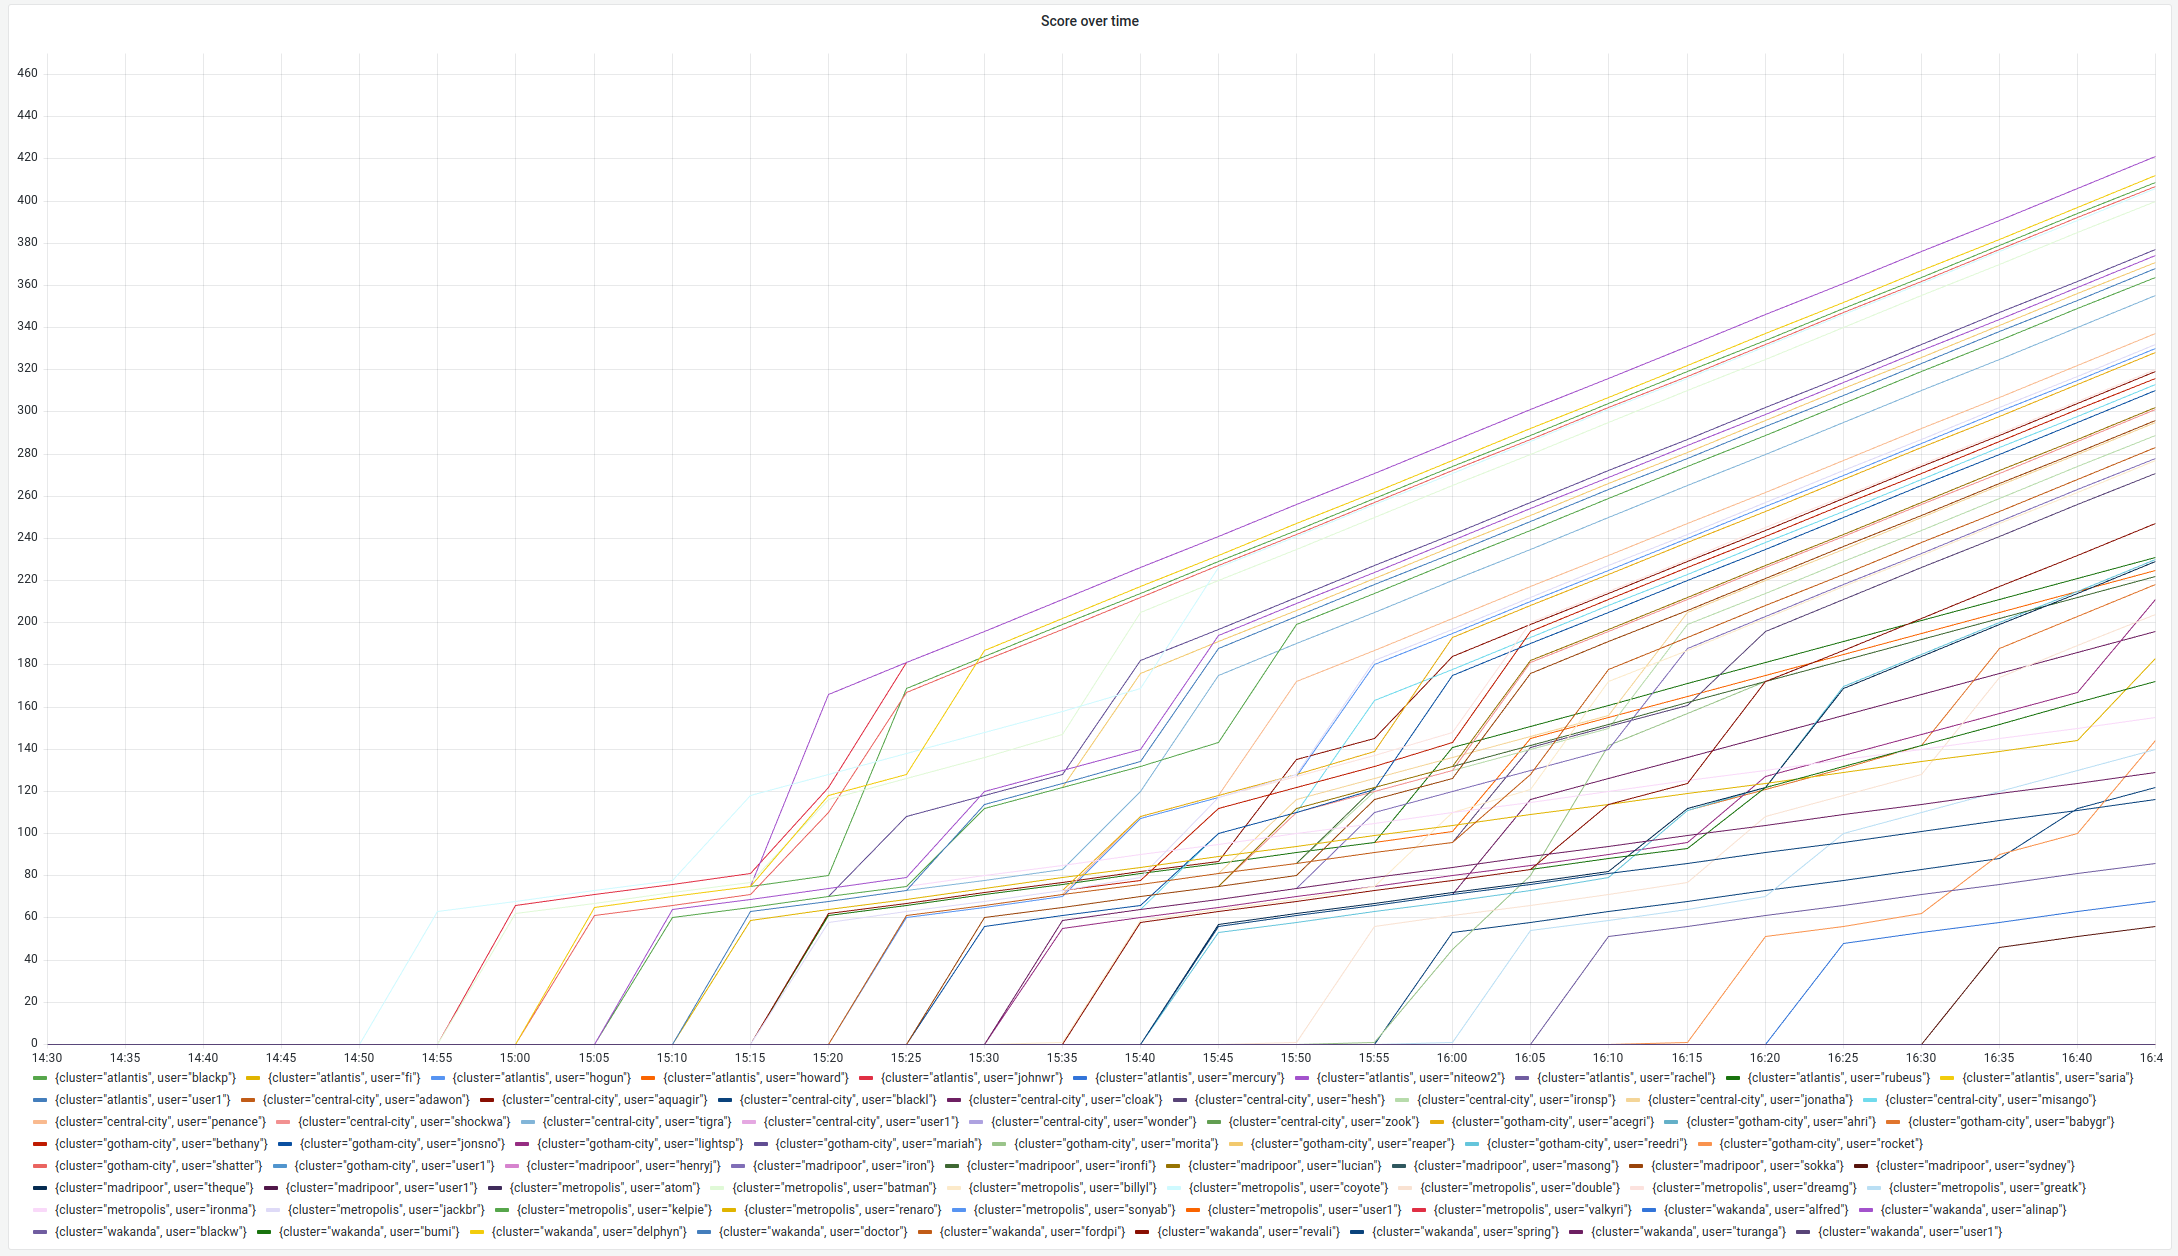
Take a look at all those intersecting curves, all those superheroes competing for first place!
Conclusion
In conclusion, the Open Code Quest was as stimulating an experience for the participants as it was for me as organiser. The project not only highlighted technologies such as Quarkus, OpenShift and IBM’s Granite model, but also demonstrated the extent to which tools such as Prometheus and Grafana can be used creatively to address very real problems.
Designing the Leaderboard, although complex, added a motivating competitive dimension to the workshop. On the day, watching the participants compete for speed while exploring Red Hat solutions was incredibly gratifying.
To find out how I implemented this Leaderboard in a multi-cluster architecture using Red Hat ACM, please visit: Behind the scenes at Open Code Quest: how I implemented the Leaderboard in Red Hat Advanced Cluster Management .